Trade-In vs. Private Sale

Plus the Science of Depreciation: A Street-Smart Guide for U.S. Sellers

AUTOMOTIVE GUIDE 2025

You've decided the current car has to go. Maybe rates softened just enough to make a newer model palatable, or the maintenance math flipped on you one repair too many. Either way, you face the same fork: hand the keys to a dealer for a clean trade-in credit or list the car yourself and squeeze more out of the market. The choice looks simple until it isn't.

In the USA, private sellers often walk away with fatter checks. The spread isn't folklore. Edmunds' 2025 data and Carvana's resale analysis peg private sale premiums around 20–30% versus trade-in offers, with trucks leaning closer to the high end. Convenience, though, has a price—and a line of fine print.

"The math is stubborn: convenience discounts value."

Let's dissect the real gap in dollars and days, then map depreciation with the clarity you wish you'd had when you bought the car in the first place. We'll also get tactical: how to read Manheim Market Report (MMR) signals, when to switch lanes from private listing to dealer desk, and how to sniff out an overpriced used car before it drains your time or bankroll.

Trade-In vs. Private Sale: The Real Numbers

By the numbers, the private route wins on raw dollars. In Q4 2025, the average trade-in offer in the USA landed near $24,500, down from $26,700 a year prior as lease returns swelled dealer lots. Comparable vehicles sold privately fetched about $29,800—roughly a 21.6% uplift—with full-size pickups often exceeding a 28% edge. The math is stubborn: convenience discounts value.

Time swings the other way. Trade-ins wrap in a day or two, sometimes in one appointment. Private listings can idle for two to four weeks, more in slower regions or for niche trims with thin buyer pools. And that clock ticks through test drives, flaky no-shows, title transfer choreography, and payment verification. Easy if you've done it before. A headache if you haven't.

Tax treatment tilts many sellers back to the dealer desk. In most states, your trade-in value reduces the taxable base of the new purchase. If your state sales tax runs 6% and you're trading $20,000, that's $1,200 saved on the spot. Private sale proceeds don't enjoy that offset, which narrows the headline premium—sometimes enough to swing the decision when the delta is small.

Regional Variations

California's EV-heavy appetite supported private-sale premiums north of 25% in 2025, as buyers chased tech-forward SUVs and well-documented battery health. In parts of the Midwest, especially Michigan, trade-ins dominated roughly 72% of transactions; winter, distance between buyers, and entrenched dealer relationships nudged consumers to the faster lane.

Risk tolerance matters. Dealerships absorb transaction risk, lien payoffs, and title errors. Private sellers shoulder all of it. The Federal Trade Commission flags fraud risks ranging from counterfeit cashier's checks to identity theft via bogus "DMV helpers." Sensible safeguards exist—meet at a buyer's bank, verify funds while present, keep plates until transfer—but each adds friction.

Car market value vs. asking price: reading the spread

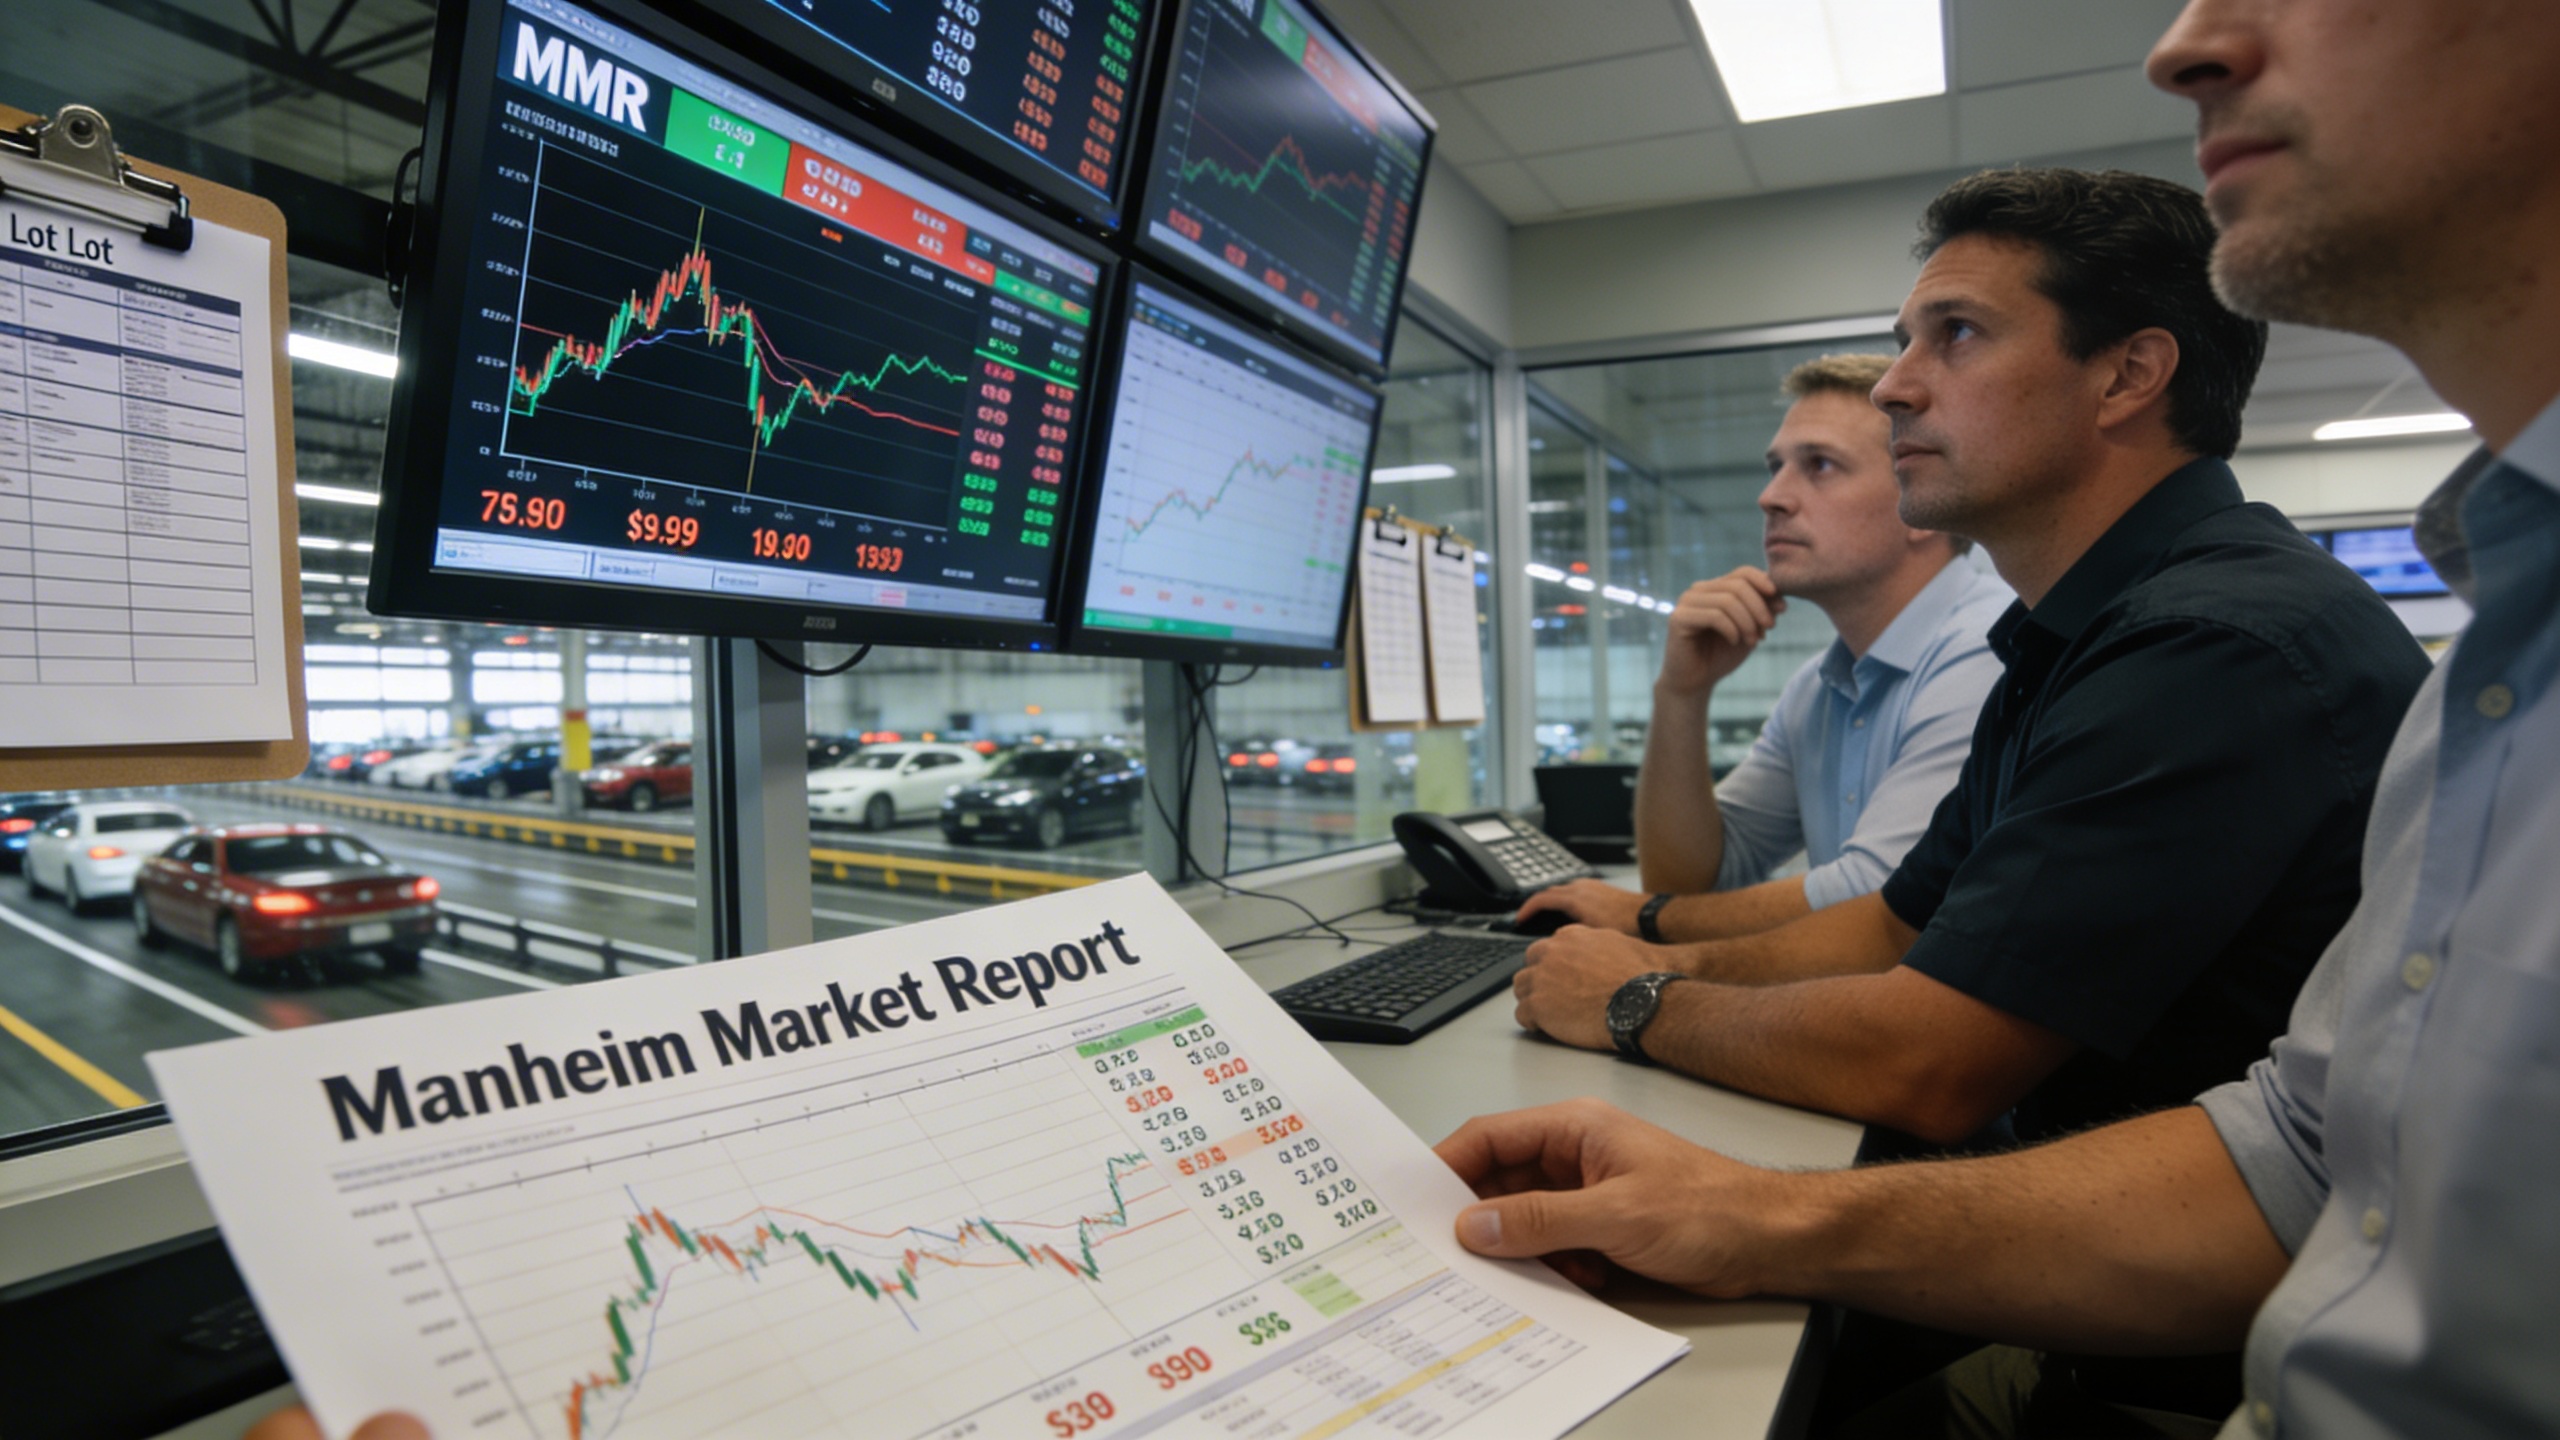
Every listing tells a story with a number. The asking price is theater; the market value is economics. To triangulate the truth, pull comps across KBB, Black Book, and recent sold listings on platforms like Cars.com, then anchor to auction-level signals from Manheim Market Report (more on MMR next). If a seller's ask sits 8–12% above recent sold comps for similar mileage and condition, you're likely staring at negotiation room, not reality.

When the trade-in actually wins

Liquidity has a price—and sometimes it's a bargain. If you're upside down, facing a big repair, or chasing a manufacturer APR incentive that requires trade-in for best terms, the dealer route can net more in total household cost than a private sale delayed by weeks. Short runway to move? Trade it, move on, and live to optimize on the next vehicle.

Dealers analyzing live MMR auction data on screens, illustrating MMR car pricing explained and wholesale car buying for consumers

Wholesale Buying & MMR Explained

Most consumers never see wholesale lanes. Dealers do—religiously. The Manheim Market Report (MMR) is their barometer, reflecting what similar vehicles actually brought at auction this week, not last quarter. Treat MMR like the heartbeat of wholesale: fast, sometimes jittery, brutally honest.

"MMR is like the heartbeat of wholesale: fast, sometimes jittery, brutally honest."

MMR car pricing explained in plain English: it's a rolling index of transaction-level prices at dealer auctions, adjusted for mileage and condition. When MMR dips, dealers get stingier on trade-ins because their exit price shrinks. When it spikes, the opposite happens—your keys suddenly look like inventory they can flip. Private sellers can mirror this logic by tracking public summaries from Manheim, watching ACV Auctions trends, and sanity-checking dealer offers against those moves.

Here's the play: if MMR drops 2–3% in a month on your segment, expect trade-in numbers to soften by a similar clip, then lag as retail prices catch up. If you insist on a private sale, undercut stale listings now and close fast before the market reprices. If MMR pops—say trucks jump mid-spring thanks to contractor demand—push for a same-day appraisal at multiple stores, then take the best written offer before managers recalibrate.

How to spot overpriced used cars

It's not a sixth sense. It's a checklist. Compare against three anchors: MMR-adjusted wholesale, recent retail sold comps, and live days-on-market. If a vehicle sits at 40 days with a price just 2% under its list from day one, the market already said no. Look for reconditioning padding too: ceramic coating and "dealer-installed protection package" rarely justify $1,500 add-ons. Negotiate them to zero or keep walking.

  • Delta test: Asking price more than 10% above recent sold comps for identical trim and options.
  • Condition drift: Photos hide curb rash, mismatched panel paint, or oddly clean engine bays (steam-cleaned leaks). Budget 10–15% discount if present.
  • Mileage math: Expect 20–30 cents per mile depreciation pressure after the first 15,000 miles, segment-dependent.
  • Title integrity: Any accident on Carfax? Start 5–15% lower, more if airbags popped.

VirtualCarHub.com's appraisal team often advises sellers to pin their first public price within 3–4% of the model's real-time MMR-influenced retail comp, then set a firm walk-away number. Sounds rigid. It saves weeks.

Understanding Depreciation Science

Depreciation isn't a villain—it's gravity doing its job. Vehicles typically lose 20–30% in year one, then glide toward 50–60% by year five. The curve varies by segment, gas prices, and tech churn. In the USA, hybrids and body-on-frame trucks keep their footing better; luxury sedans stumble as options age and repair costs loom.

Mileage drives the bulk of loss because miles represent risk—future repairs, worn components, the unknowns you inherit. As a rule of thumb, budget $0.20–$0.30 per mile in value erosion outside that initial year-one cliff. Condition is the silent multiplier. Bodywork? Plan on a 10–15% haircut. Worn interiors? Buyers imagine neglect in places they can't see. They bid accordingly.

Tech obsolescence bites more than it used to. Infotainment that lags, ADAS features a generation behind, weak range or slow charge curves on EVs—all punish resale. The EV segment remains volatile: some models freefall early, then stabilize as new MSRP cuts ripple through the market. Others hold because demand still outstrips rational pricing.

Depreciation Levers You Control

Keep service history crisp and centralized. Two meticulous oil-change intervals do more for perceived value than a detail ever will. Replace windshield chips early, treat leather, and refresh worn touchpoints like shift knobs or mats. Small money, big optics.

Here's a bright spot: certain nameplates shrug off the curve. iSeeCars' 2025 study shows Toyota Tundra and Tacoma, Jeep Wrangler, and the Corvette holding north of two-thirds of their value at five years. That's not marketing. It's a pattern of loyal buyers, cheap-to-maintain reputations, and limited supply of clean examples.

Which vehicles hold value best

  • Toyota Tundra: Retains roughly 72.5% at five years. Demand outpaces supply, and the ownership base babies these trucks.
  • Chevrolet Corvette: About 70.1%. Sports car outlier with fervent communities and limited clean inventory.
  • Toyota Tacoma: Around 68.3%. Utility plus reliability becomes a resale flywheel.
  • Jeep Wrangler: Close to 67.9%. Lifestyle tax—people pay for doors-off summers and trail cred.
  • Honda Ridgeline: About 65.4%. Practicality wins, especially with buyers chasing lower total cost of ownership.

Regional watch

Coastal markets chase EVs and hybrid SUVs; inland markets lean trucks and crossovers. If you're in the USA mountain states, all-wheel drive, block heaters, and snow-ready tires close deals faster. Sunbelt buyers pay up for working AC and clean undercarriages without rust shadows. Price to your ZIP, not a national average.

Zoom out and the macro matters. After the chip shortage era that spiked new prices to around $48,000 on average in 2022, used values surged, then cooled through 2025 as supply normalized. Manheim's index steadied into early 2026, with average used prices in the USA circling $27,200. Translation: depreciation resumed its old rhythm, just off a higher base.

Real Dealership Results

Dealerships aren't oblivious to private-sale premiums; they survive by arbitraging time, risk, and reconditioning capability. In a market flooded with 2022–2023 lease returns, Cox Automotive's chief economist suggested that private sellers who price to move using real-time comps and auction signals can capture outsized gains. Still, a large swath of consumers opts for the cleaner, quicker transaction. Rational, given life's time constraints.

Where does that leave you? Calibrate to your reality. If your next vehicle hinges on an incentive expiring this weekend, the instant liquidity of a trade-in may be the winning play. If you can wait two weeks and handle a few test drives, that 20%+ lift is very real—especially on trucks and well-kept SUVs with complete service records.

"Make the spread work for you, not the other way around."

VirtualCarHub.com often threads the needle for U.S. clients by pairing dealer-grade appraisals with market-facing guidance. The team will pull MMR-adjacent signals, cross-check live listings, and help you decide whether to take a top-of-market trade or hold for a fast private sale. Either way, the goal is the same: make the spread work for you, not the other way around.

Negotiation micro-strategies that work

  • Get two written offers same day. Managers sharpen pencils when a competitor's number is live.
  • Ask for a recon line-item printout. If they claim $1,800 in tires and brakes, confirm specs and brand.
  • Anchor on comps, not feelings. Walk in with three VIN-level matches sold in the past 14 days.